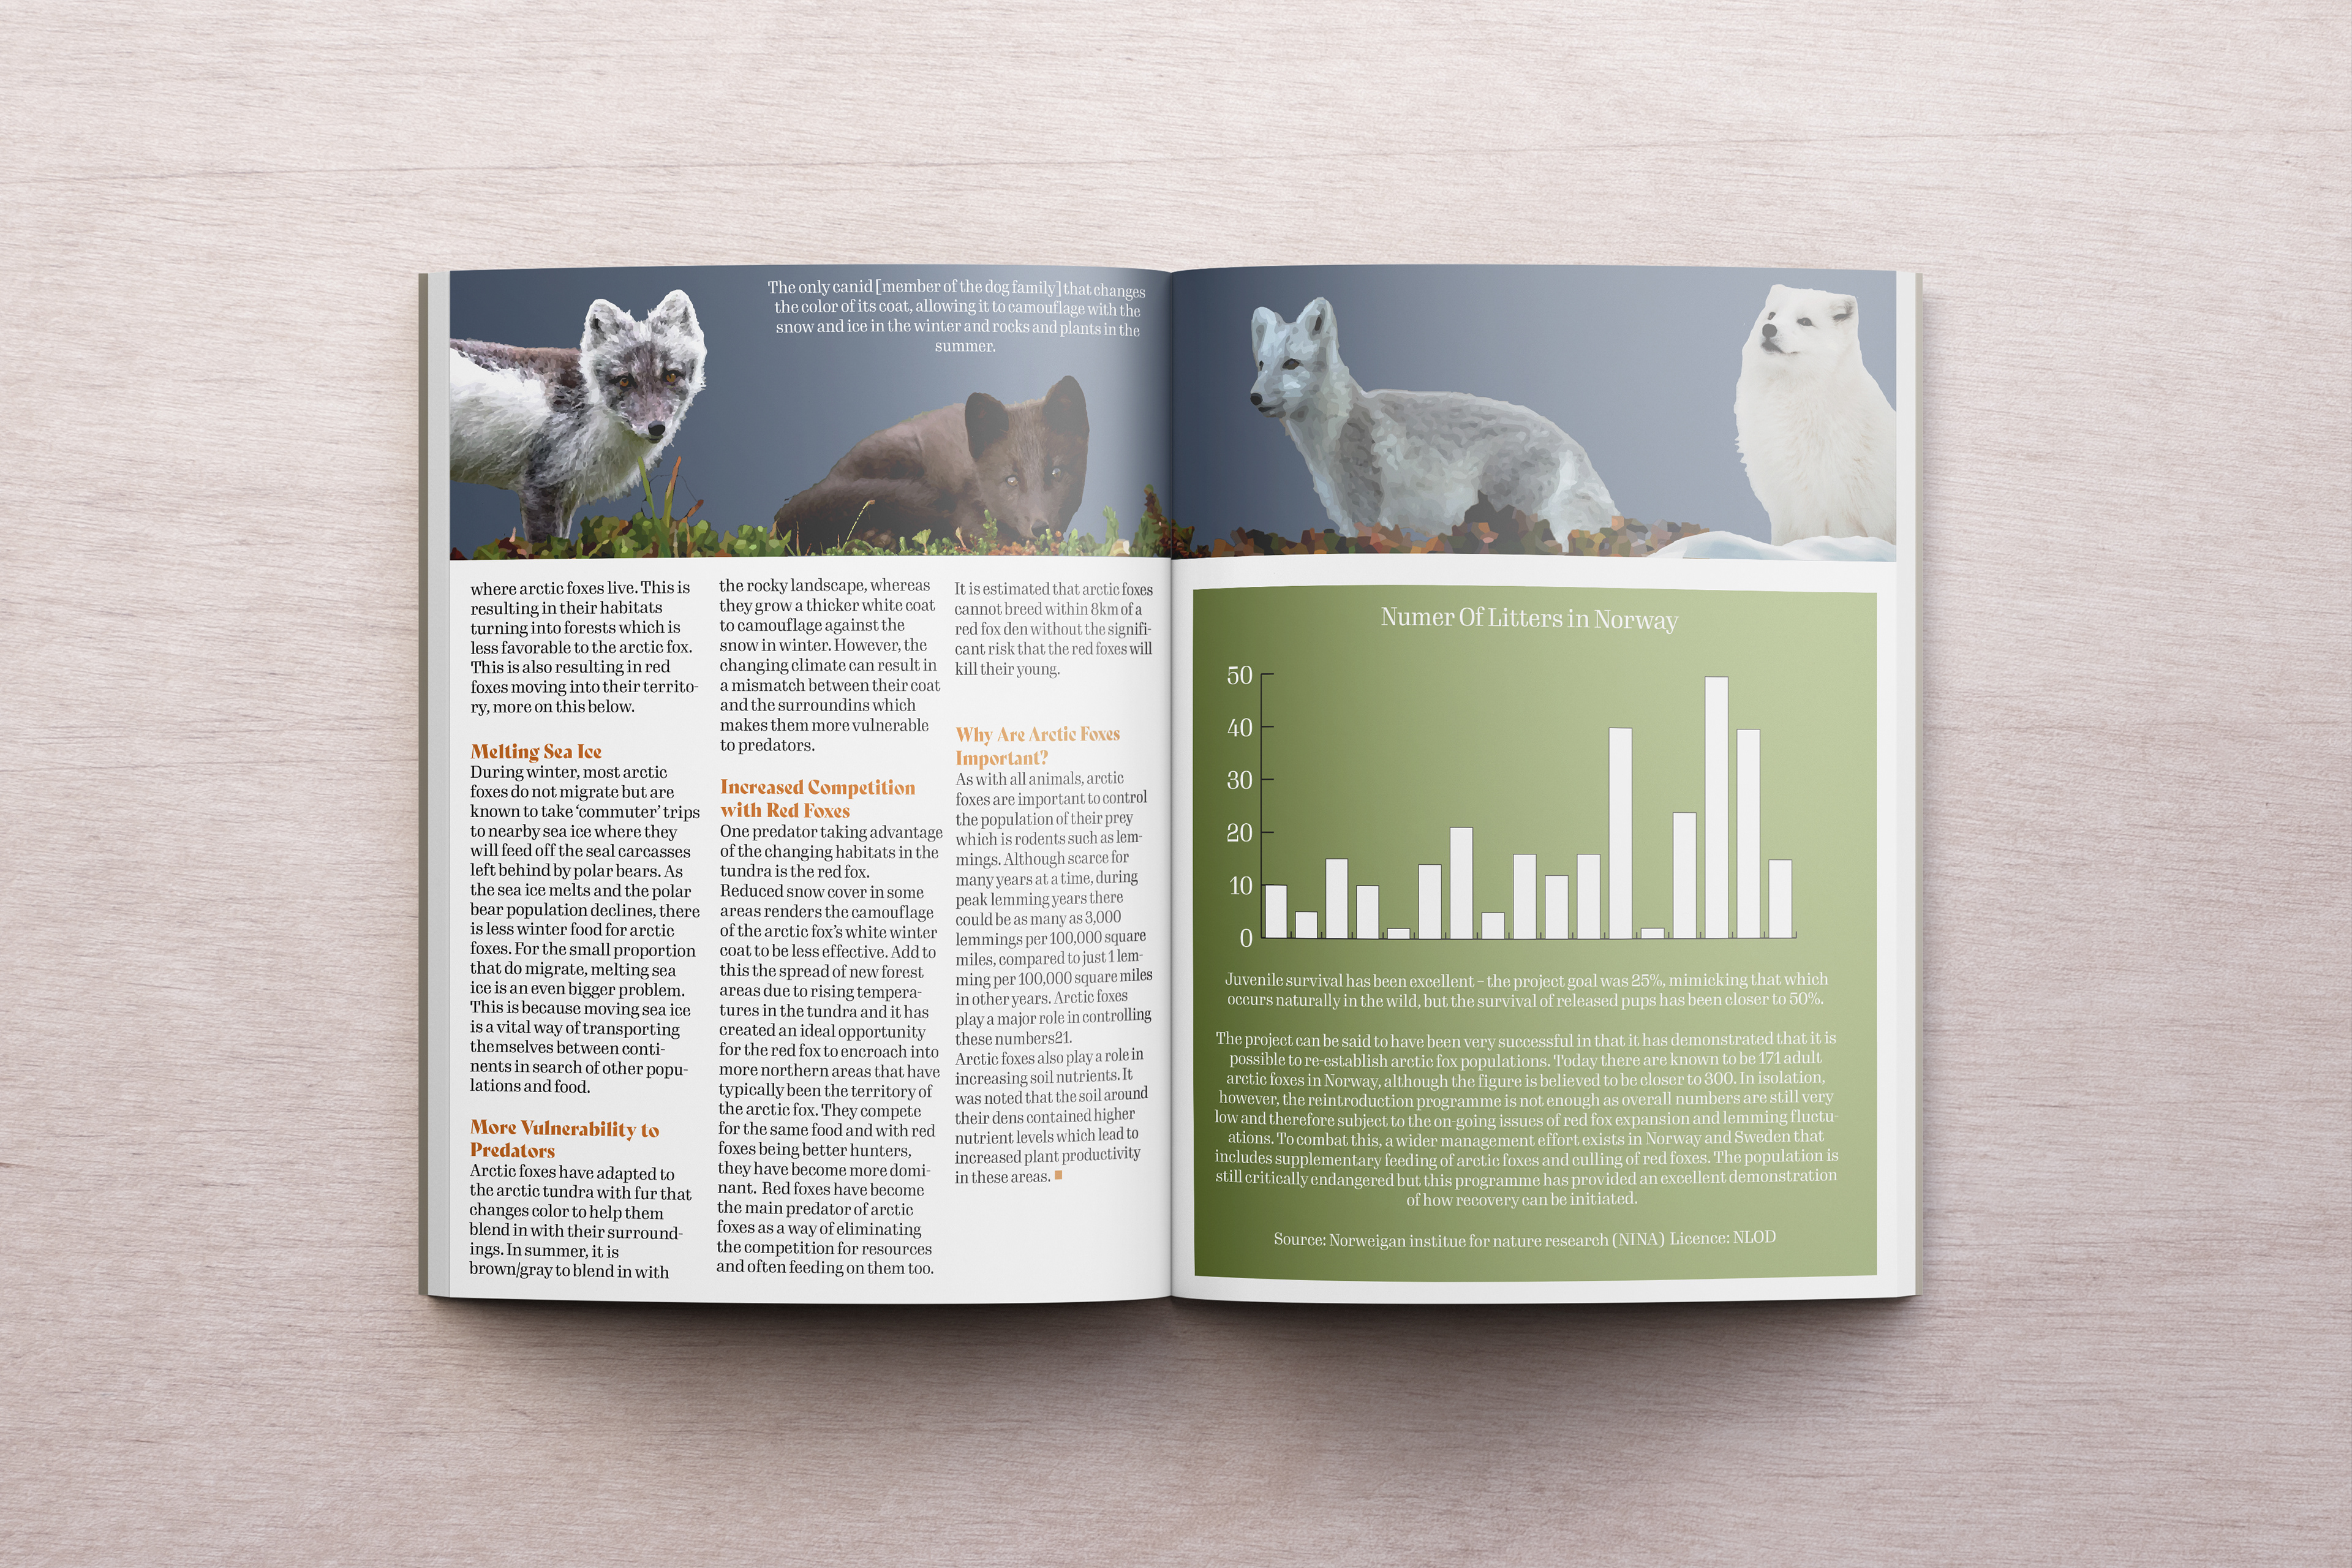
For this project, we were assigned an endangered animal and were instructed to create a two spread infographic with either filler text or an actual article as well as illustrations and data visualizations corresponding with our animal. Color was also important to the flow of the infographic so for my main two colors I chose blue and orange to represent the Arctic Fox and the environment it lives in. The pop of green is to represent data coming from a different source.
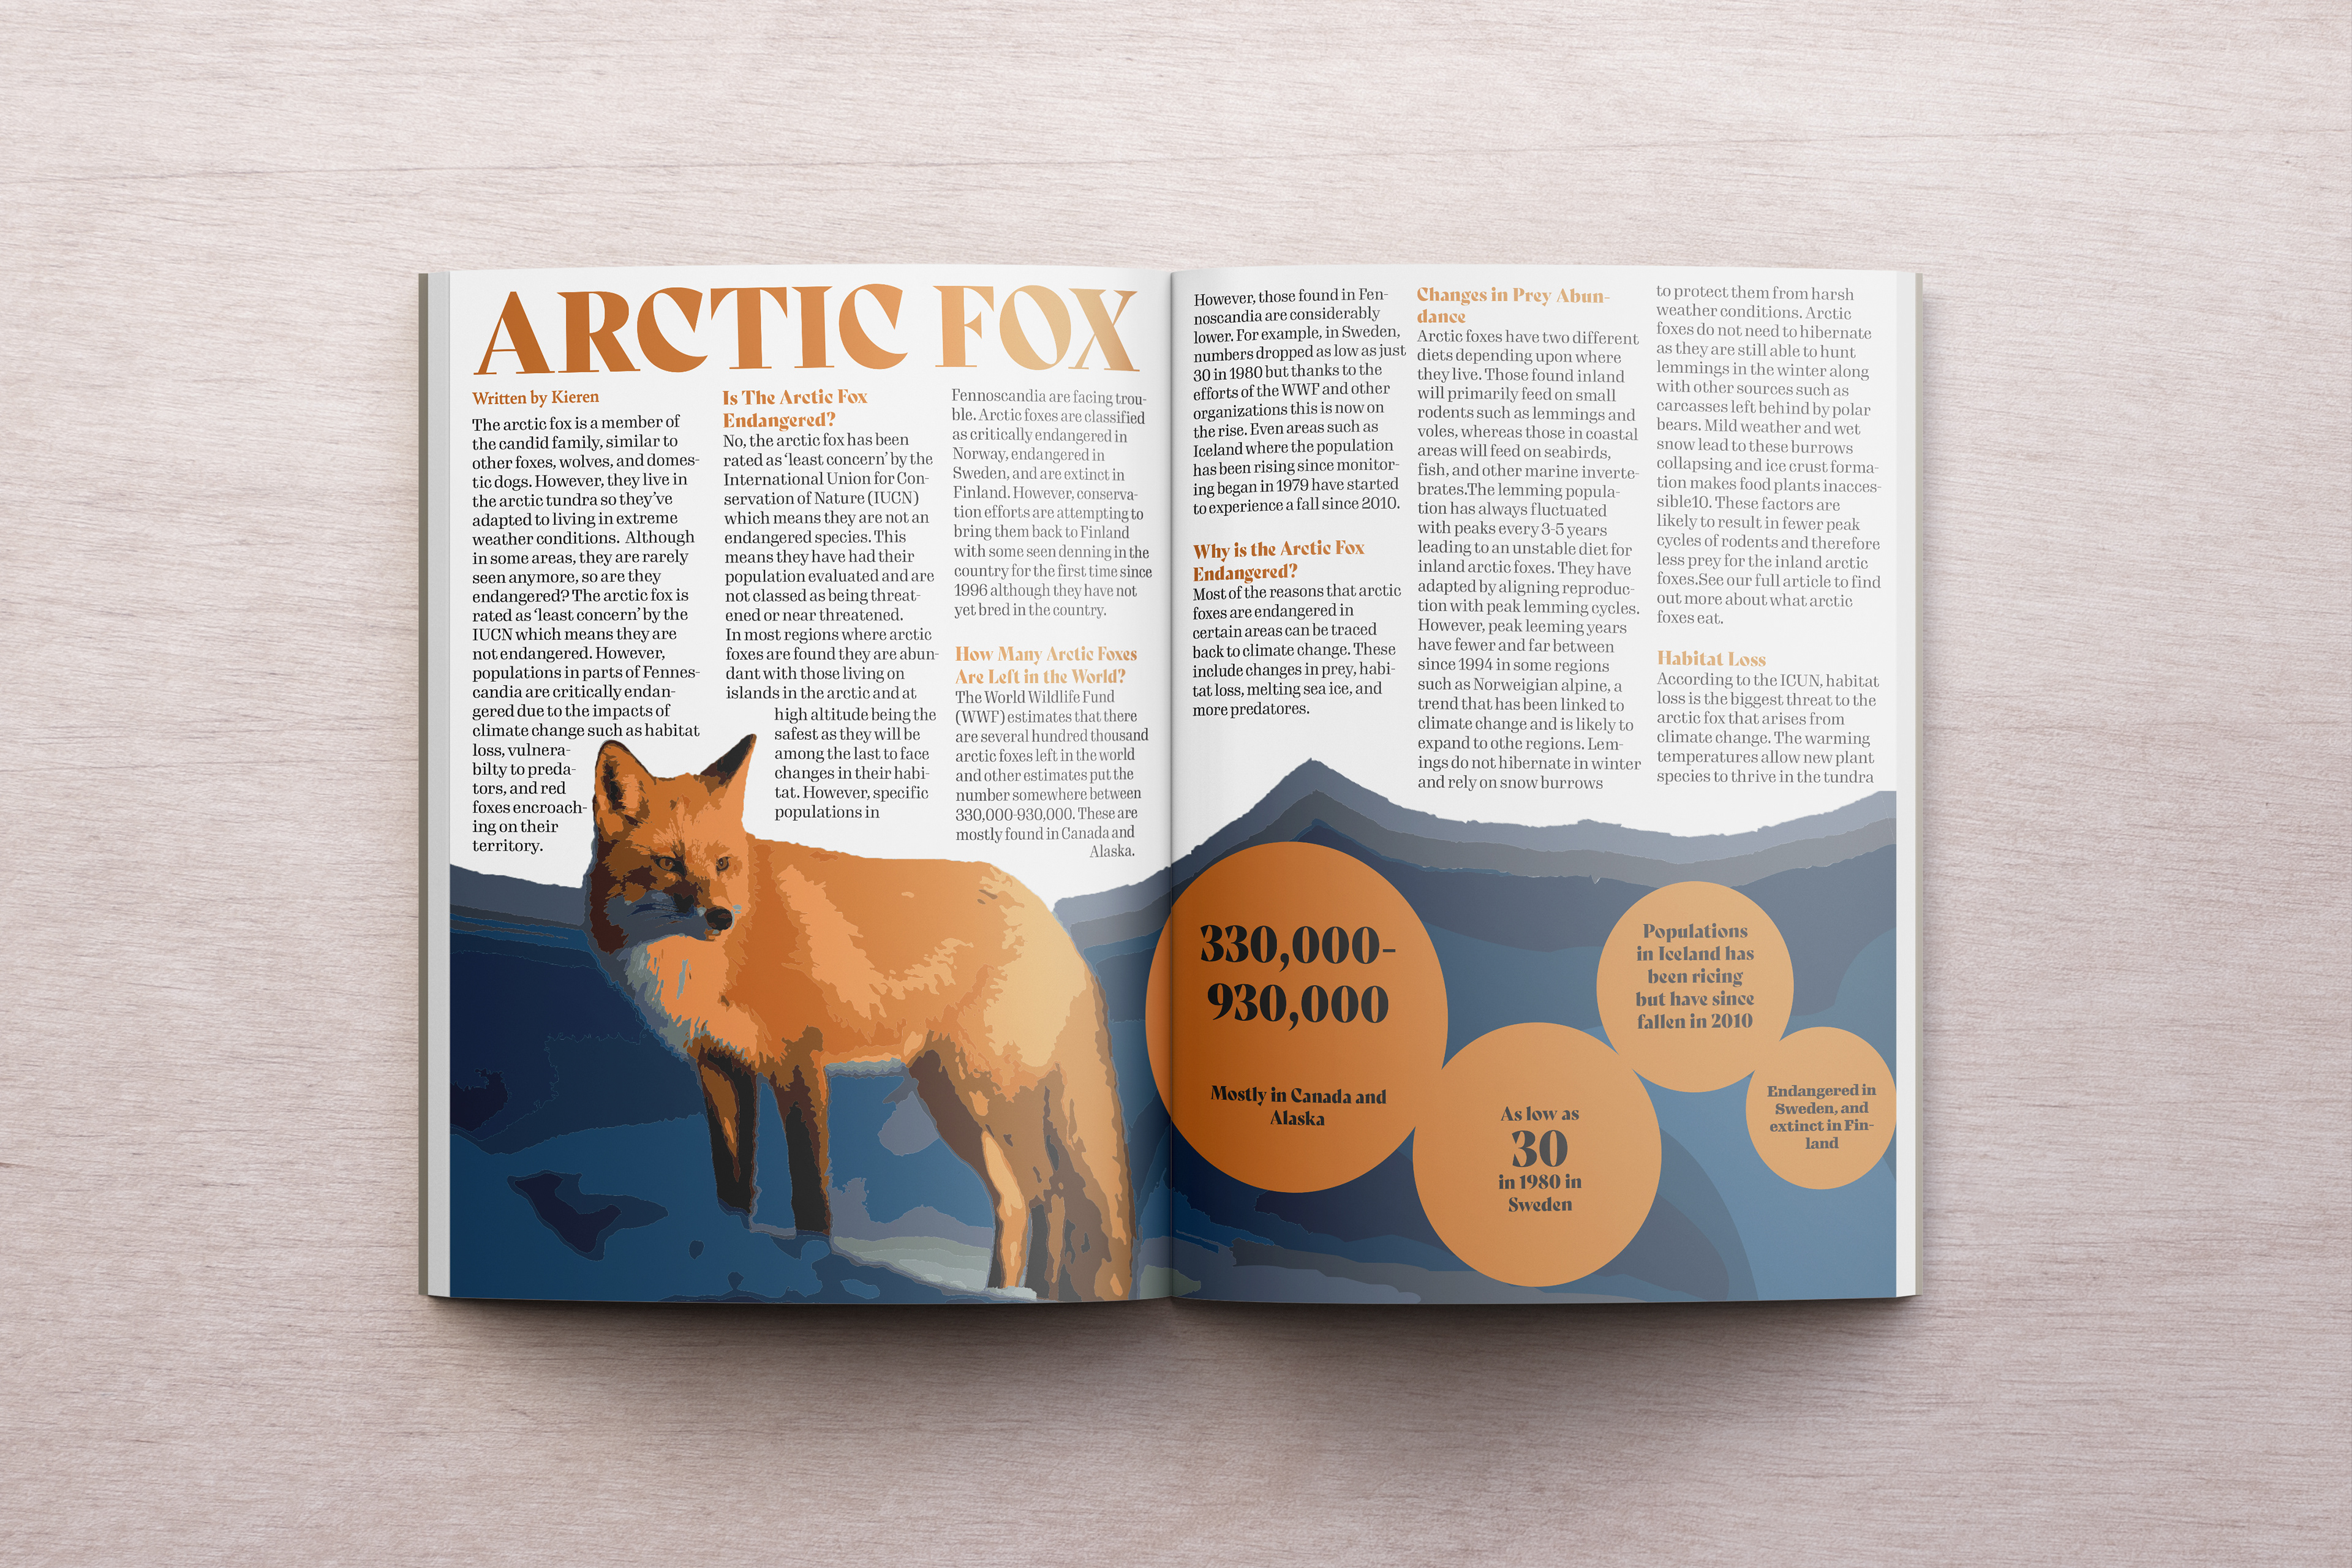
First Spread
